Bad debt. It’s become the bogeyman of revenue cycle management—haunting dashboards, driving decisions, and distorting the truth about patient financial experience.
That’s because bad debt percentage, while a staple financial KPI, is a terrible proxy for how patients actually experience your billing process.
You can reduce bad debt while making patient experience worse—or improve experience while bad debt stays flat. There’s not always a direct correlation.
And that disconnect matters. At a time when hospitals are operating on 2% margins (in a good scenario), while patients shoulder more of the cost of care, there’s little room for error. Investing in the wrong initiatives or adopting strategies that look good on paper but harm patients is a risk most organizations can’t afford.
Here’s why bad debt percentage falls short as a patient experience metric, what metrics to measure alongside it—and how one health system learned this lesson the hard way.
Why bad debt can’t measure experience
The fundamental problem with bad debt is how it views patients. The one who paid their bill in two minutes through the portal appears the same as one who received threatening letters from a debt collector and paid out of fear. Both look like resolved accounts in standard reporting, even though one had a great experience and the other did not.
Operational and accounting changes can also artificially move bad debt numbers overnight. A small policy change in charity thresholds can shift write-offs dramatically without any change in patient payment behavior.
Then there’s the lag. Bad debt write-offs reflect patient experiences from months ago, and due to seasonality in collections, you need a full 12 months of data to detect any meaningful patterns or improvements. By the time bad debt shows you there’s a problem, you’ve already had a year and a half of poor patient experiences that have gone unaddressed.
“I look at revenue cycle KPIs every single day. But when it comes to the patient experience, the main feedback mechanism I get is the complaint that’ll escalate to my desk. That’s not a great way to understand the pulse of what’s going on with your patients.”
CFO of an academic medical center
What to track for experience insights
What if the issue isn’t what you’re measuring, but what you’re not? To fill this gap, we recommend revenue cycle teams track these two companion metrics alongside bad debt percentage:
- Bad Debt Collection Ratio: The percentage of your patient collections that come through bad debt agencies. It shows how many patients want to pay but are experiencing barriers in your billing process. If this ratio is high, you have a process problem, not a payment problem.
- Bad Debt Opportunity Ratio: Annual bad debt write-offs as a percentage of total net patient revenue (not gross charges, which are inflated). This gives you a clearer view of your actual improvement opportunity and helps you size the real financial impact.
These metrics work together to tell the story that bad debt percentage can’t: whether patients are unable to pay or unable to navigate your payment process.
Case study: More cash—but at what cost?
One Epic-based health system’s experience demonstrates why tracking the right metrics matters for your patient financial experience.
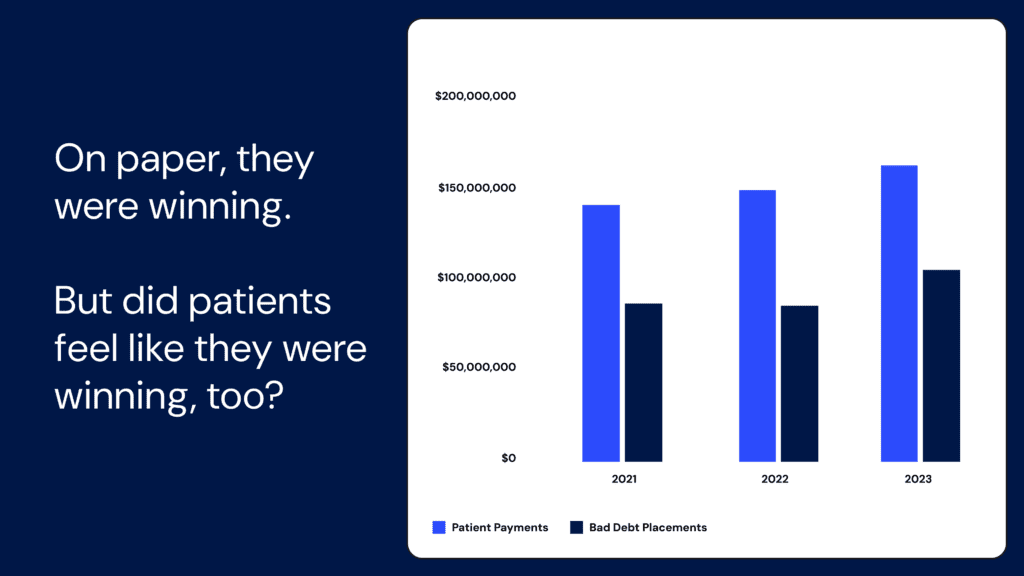
On paper, they looked like a success story:
Major EHR upgrade? Complete.
EHR accolades for feature adoption? Earned.
High patient portal activation? Check.
Patient cash up 8% in one year? Impressive.1
Many health systems would’ve stopped there, relying on EHR reporting to measure success. But this system wanted to dig deeper.
Using Cedar’s PFX Benchmarks, they found that their bad debt placements were rising as well. Despite optimizing their use of the EHR for text, email, and patient portal communications, 10% of their total patient payments were coming from collection agencies—3x higher than what we typically see.2 Not exactly the experience anyone wants to deliver.

Going one step further, the health system discovered patient billed amounts increased 22% since 2021.3 So while cash was up, it was largely due to higher patient volumes, not improved performance from digital adoption.
These nuances can easily be missed if you’re only looking at traditional revenue cycle metrics. If this provider had relied solely on their EHR dashboard, they would have seen “cash is up” but missed critical insights about the patient experience.
Bottom line
As of April 2024, 15 million Americans have medical bills on their credit reports.4 Many are likely patients who wanted to pay but couldn’t navigate the billing process. Others received bills they shouldn’t owe in the first place.
Revenue cycle leaders see these numbers and know something’s wrong—they’re hitting their bad debt targets but patient satisfaction scores aren’t improving. They’re investing in new technologies and seeing cash collections rise, but the complaints keep coming.
It comes down to this: you’re using a financial metric to solve an experience problem. Bad debt percentage tells you what was written off—not whether a patient waited on hold trying to set up a payment plan, or gave up after receiving three confusing bills for the same visit.
The patients who want to pay shouldn’t have to fight your system to do it. And revenue cycle teams shouldn’t have to guess whether their improvements are actually helping patients or just moving numbers around.
Track what matters to both:
Can patients understand their bill?
Can they pay easily?
Can they easily access affordability solutions?
Are you making it simple, or accidentally pushing them toward collections?
Because when patient financial experience improves, the financial metrics follow. But it doesn’t work the other way around.
Alli Eschbach is Former Sr. Director, Value Analytics at Cedar
- Cedar. (2023). Based on comparison between patient cash in 2022 and 2023 at an academic medical center. ↩︎
- Cedar. (2024). Based on 2024 Cedar PFX Benchmarks for bad debt collection ratio. ↩︎
- Cedar. (2023). Based on comparison between patient billed amounts in 2021 and 2023 at an academic medical center. ↩︎
- Consumer Financial Protection Bureau. (2024, April 30). CFPB finds 15 million Americans have medical bills on their credit reports. ↩︎


