Let’s face it, patients are the fastest growing payer in a healthcare organization’s book of business. With the uptick in enrollment in high-deductible health plans in recent years, the trend shows no signs of slowing down. This means that having a detailed understanding of patient payment trends is now critical for effective financial planning.
Here at Cedar, we’ve developed a practical solution: our seasonality index. We use it to analyze the percentage of annual post-visit payments in each month, helping our clients understand how time of year impacts performance.
In this post, we dive into historical first quarter trends and offer a glimpse of what might lay ahead in the second quarter.
Disclaimer: Patient payment seasonality is subject to change based on operational changes, held claims, technology, regulatory changes and external events.
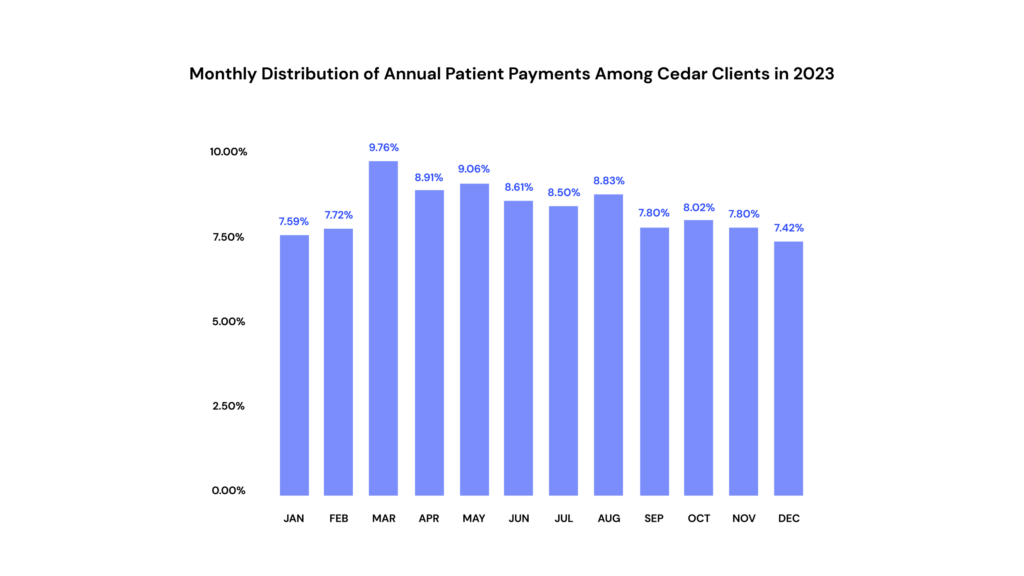
March is the top paying month
Across health systems, medical groups and physician staffing groups, we consistently see the largest proportion of annual payments in March. Higher billings, deductible resets and tax return season all culminate in a surge of payments during this month. Medical groups, in particular, see a higher share of payments (13%) compared to health systems (10%) and physician staffing groups (9%).
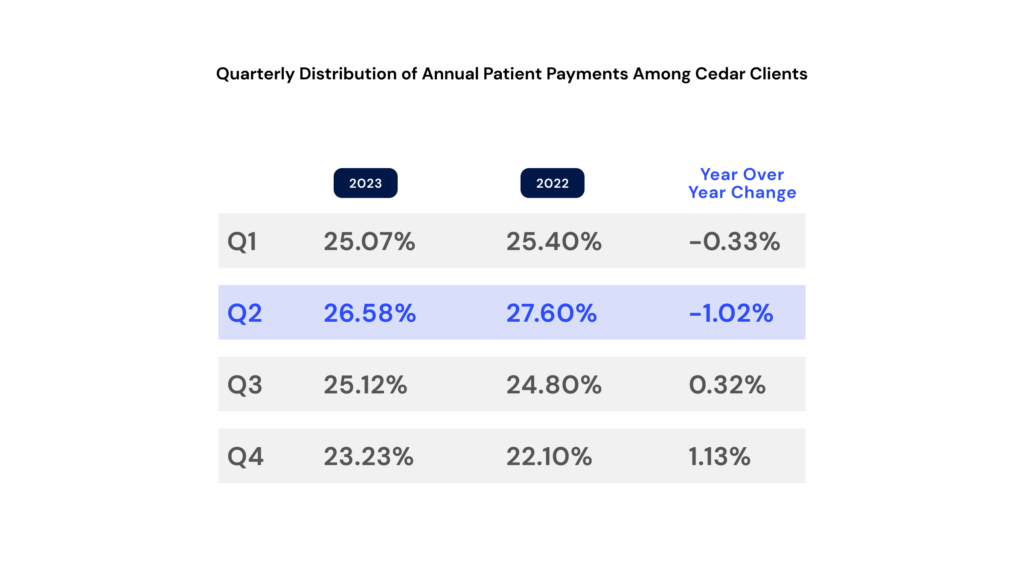
Although annual projections shouldn’t be based solely on the results of a single month in Q1, health systems can still get a sense of their performance for the entire year. Typically, this quarter accounts for about 25% of payments within this segment.
When it comes to seasonality trends for 2024, consider the following:
- 2024 is a leap year. This could increase payments in February, potentially decreasing the proportion of payments in March.
- For organizations impacted by the Change Healthcare outage, the proportion of payments in March may not be as high as in years’ past. As a result, these organizations may see a higher proportion of payments in April and May.
Q2 sees the most payments
Building on the momentum in March, Q2 has historically been the highest payment quarter. Last year, health systems and medical groups captured 27% of annual payments in April, May and June, which are the top paying months behind March. Comparatively, physician staffing groups tend to have an even distribution of payments throughout the year, capturing 25% in Q2 2023.
What this means for patients
While organizations typically see higher payments in the first half of the year, it’s important to recognize that patients face higher out-of-pocket costs during this period. What’s more, the 2023 Commonwealth Fund Health Care Survey found that four in ten adults with employer coverage struggle to afford medical bills. This highlights the need for organizations to review financial policies now. For example, ensuring there is adequate support for underinsured populations and revisiting payment plan guardrails.
The bottom line
Patient payment seasonality is more than a statistical exercise; it’s a crucial element in financial planning. It’s also just one way Cedar helps organizations make sense of their patient financial data. We don’t leave our clients wondering about what to expect or what “good” looks like.
For more insights like these, click “subscribe” below.
Alli Eschbach is Senior Director, Value Engineering at Cedar