Healthcare is often compared to industries that digitized years ago—banking, travel, retail. And while there’s plenty healthcare can learn from their tech-driven approach to customer experience, there’s a fundamental difference those comparisons miss:
They can afford to write off the margins. If a bank’s app doesn’t work for 15% of customers, those people can simply find a local credit union. The bank will be just fine.
Hospitals can’t. Their operating margins are razor-thin, more like restaurants than banks. But unlike restaurants, hospitals serve populations with nowhere else to turn—people facing affordability barriers, coverage gaps, limited health literacy, and chronic conditions.
When these patients cannot easily access the billions in financial assistance available to them, they miss payments, fall into bad debt, or worse, ration medications or skip care altogether. The medication piece alone reveals the scale of this problem: pharmaceutical manufacturers fund $5 billion annually1 in assistance, yet only 3%2 of eligible patients actually receive it.
It’s why Cedar built a solution that automatically connects patients to these resources, right within the bill pay experience. This helps patients access manufacturer copay programs and foundation aid to reduce their out-of-pocket costs, while making sure providers receive reimbursement for care delivered.
Now that our medication assistance solution is live, we’re seeing clear patterns in patient behavior.1 Here’s what we’ve learned so far—and how we’re using those insights to build solutions that actually work at the margins.
The following data and insights are from patients who engaged with Cedar’s medication assistance solution at a large health system between February and May 2025.3
Insight #1: What stops (and helps) patients depends on age
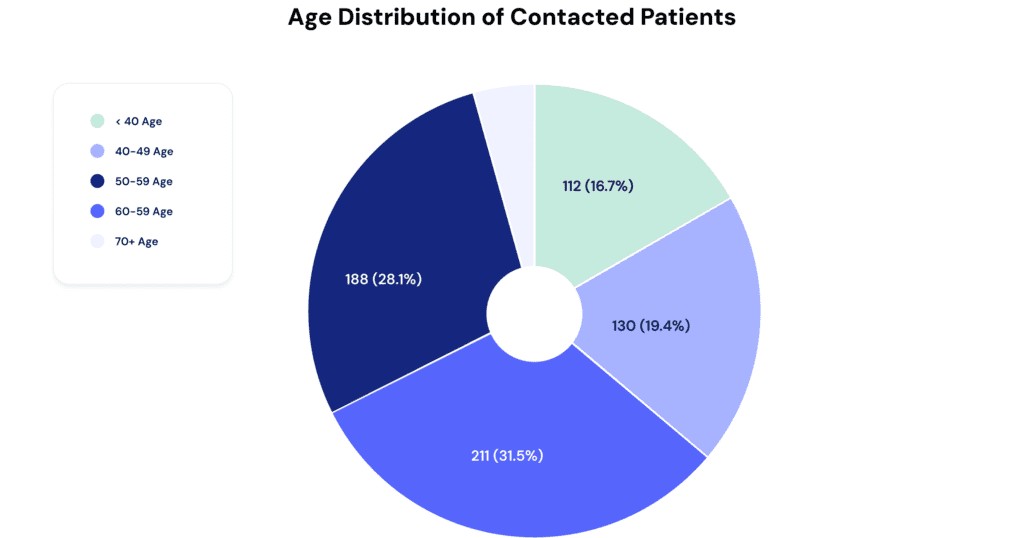
About 65% of patients eligible for medication assistance are over 50. That’s not surprising—many drug discount programs target conditions like cancer, which are more common with age. But it does mean we need to design with older users in mind: a group that’s open to digital engagement, but only succeeds when workflows are simple and accessible.
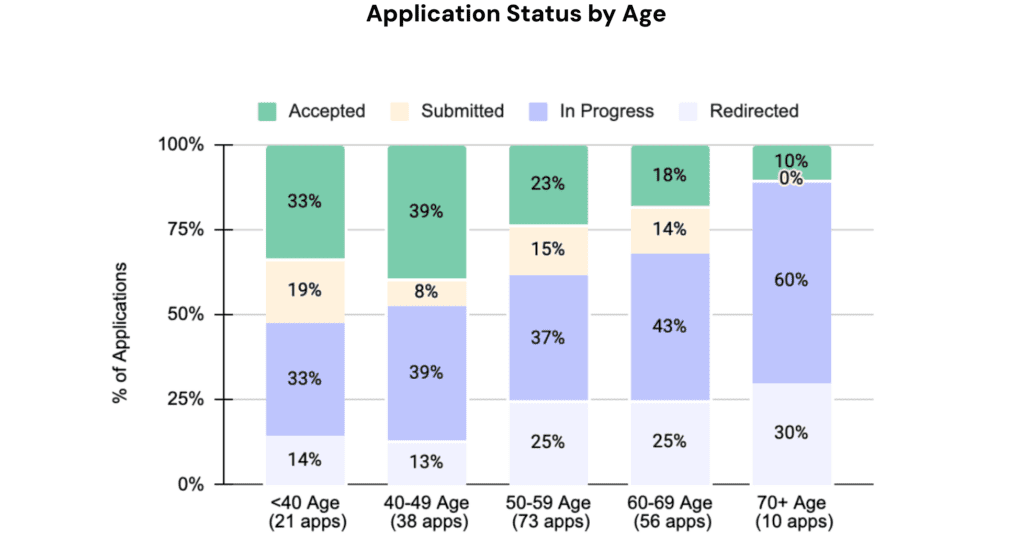
Once contacted, older patients are more likely to start applications (35% vs. 25% for younger patients) and complete them faster (22 days vs. 30 days)—if the steps are clear.
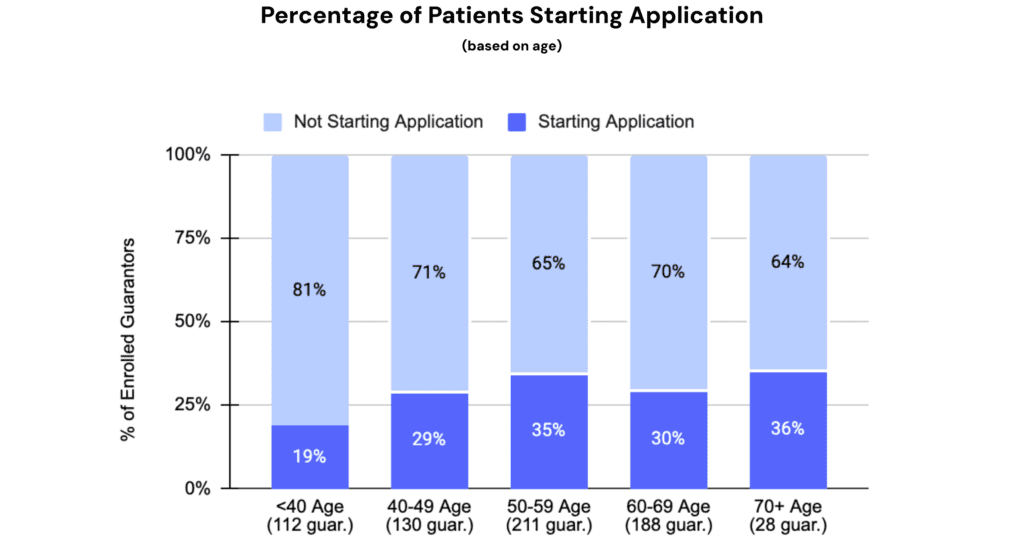
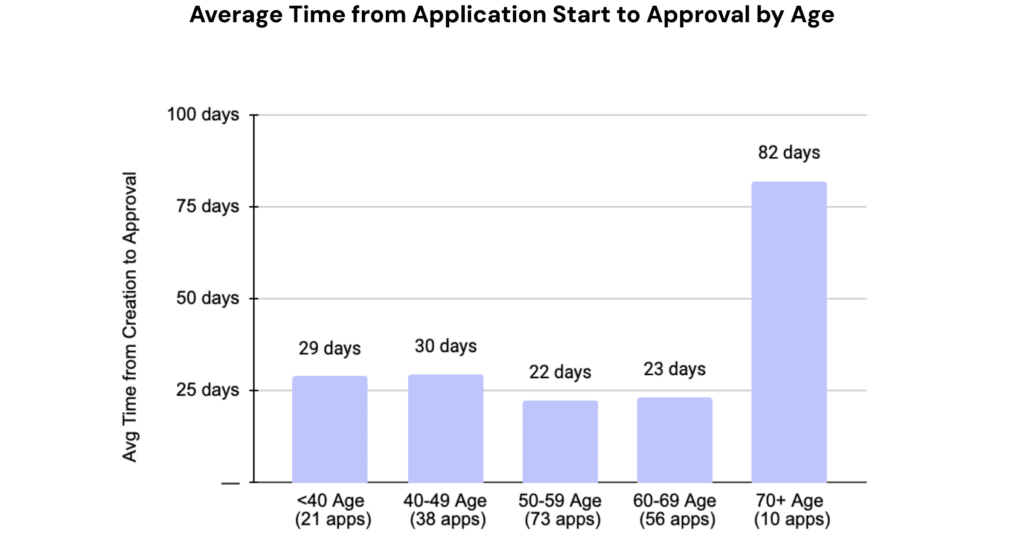
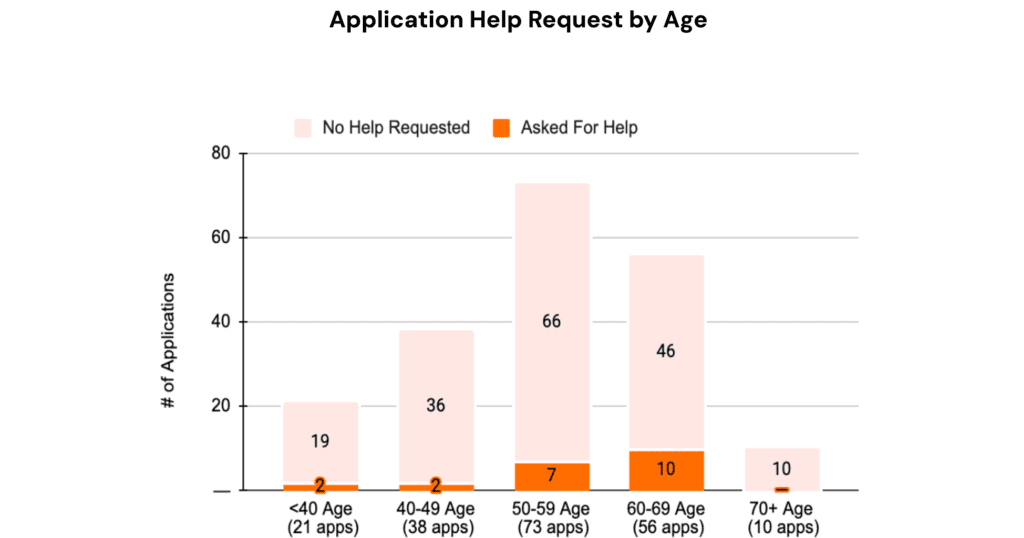
Yet their approval rates are significantly lower (10–20% vs. 35% for younger patients), and they ask for help more often.
So what gives?
This suggests that older patients are motivated but struggle with the complexity of the application itself. To support them, we’re focused on simplifying submission: clearer instructions, easier-to-use tools, and human support when needed.
Younger patients, by contrast, are less likely to start—but more likely to be approved. For them, the challenge is initial engagement. We see this as an opportunity to provide personalized outreach that highlights the immediate value of aid and creates a sense of urgency.
Insight #2: Frequent flyer or not, the process must be easy
Visit frequency offers another important lens into behavior, helping us tailor how we support patients. About 90% of patients that are eligible for medication assistance visit their providers at least monthly, if not more often. This high frequency likely reflects the nature of manufacturer discounts, which often target high-repeat medications like cancer infusions that require regular visits.
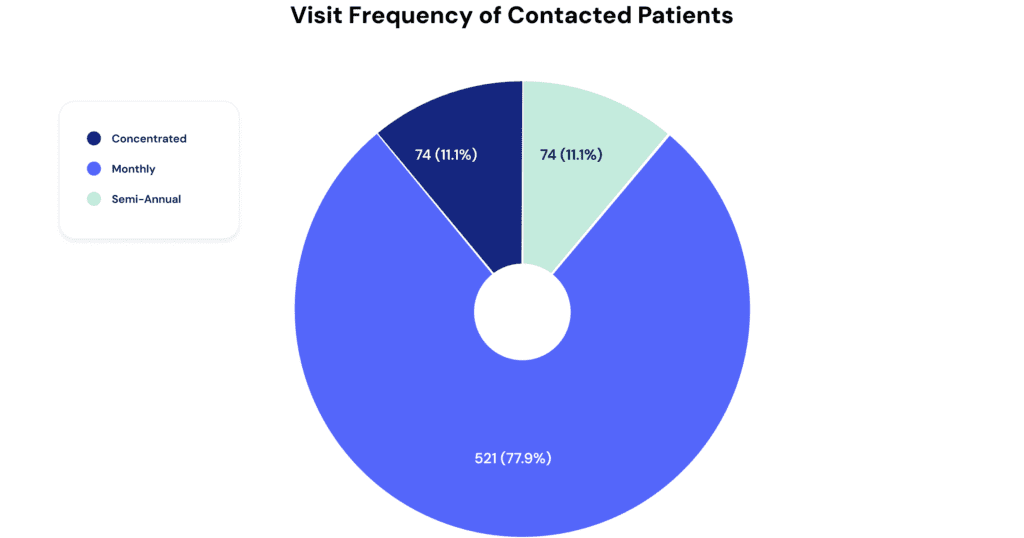
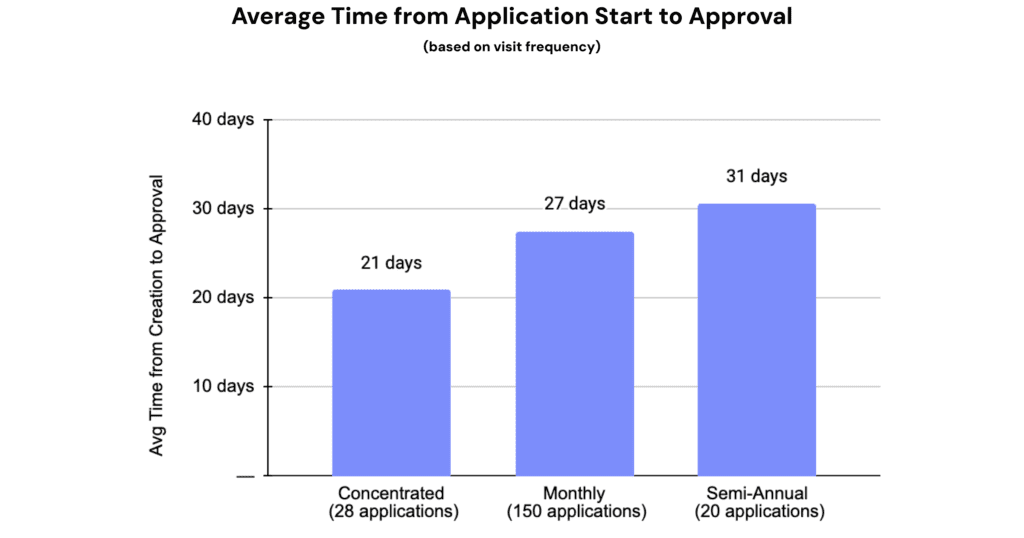
These “frequent fliers” demonstrate strong engagement: they start more applications (around 40% versus 30% for infrequent visitors) and complete them faster (averaging 20 days compared to 30 days).

What does this mean?
Frequent visitors’ regular appointments create a routine that keeps their financial needs top of mind. This steady engagement presents a significant opportunity: by accelerating their application submissions and approvals, we can drive greater, year-round impact—improving both patient financial well-being and provider reimbursement.
For infrequent visitors, the approach must shift. Initial communications should emphasize the value and urgency of financial assistance while making the process exceptionally easy to understand and act upon—especially given their competing priorities.
The bottom line: reducing both the perceived and actual cognitive load of the application is key to improving submission rates across all patient segments.
Insight #3: It all comes down to the last mile—submission
Across all patients included in the analysis, about 85% engage with the medication assistance solution once they become aware of it (black line below), and a strong 30% of those who start the application reach final approval (purple line below). These numbers clearly demonstrate the program’s value and patients’ genuine interest.
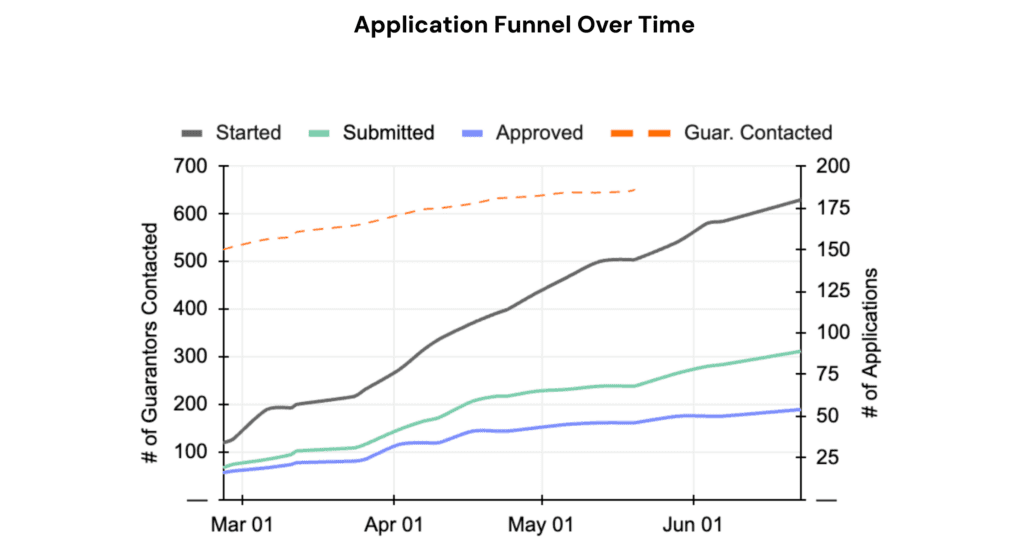
But the biggest barrier remains the submission step—only around 50% of patients who begin applications successfully complete submission (green line above).
To improve outcomes, we need to simplify the submission process itself. This means applying what we’ve learned about age and visit frequency, while also pursuing broader innovations: developing a common application accepted by multiple manufacturers, automating form pre-filling using integrated data, and providing proactive operator support for complex or confusing sections.
Closing the gap in medication assistance
We said healthcare could learn from industries that digitized first. But what’s worth mimicking isn’t their customer experience—it’s their relentless focus on measuring and improving it.
Banks know exactly when a customer abandons a loan application. Retailers track every cart left behind. That’s the mindset we’re bringing to medication assistance and other support programs.
We’ve mapped the patterns. We know where patients get stuck. Now we’re optimizing the experience by simplifying workflows, personalizing outreach, and making medication assistance accessible to the people who need it most.
Because for patients on the edges, every barrier matters—and providers can’t afford to let any slip through, not when their mission and margin are both on the line.
Vaibhav Goel is Director of Product Management at Cedar
- BioPharma Dive. (2023, March 27). The 3 biggest barriers to patient services program utilization. BioPharma Dive. https://www.biopharmadive.com/spons/the-3-biggest-barriers-to-patient-services-program-utilization/645843/ ↩︎
- Deloitte. (2023). Designing next gen pharmaceutical patient support programs. Deloitte. https://www.deloitte.com/us/en/Industries/life-sciences-health-care/articles/improving-patient-support-programs-in-healthcare.html
↩︎ - Cedar. (2025). Analysis of patients who engaged with Cedar’s medication assistance solution at a large health system between February and May 2025. ↩︎

